Metrics
The Metrics Dashboard allows you to transform sentence-level labels from ZQ Classify into document-level metrics. By building custom formulas, you can quantify financial trends directly within your Snowflake environment.
All metrics are calculated and grouped by DOCUMENT_ID, aggregating the specific labels assigned to sentences within those documents.
Metrics Dashboard
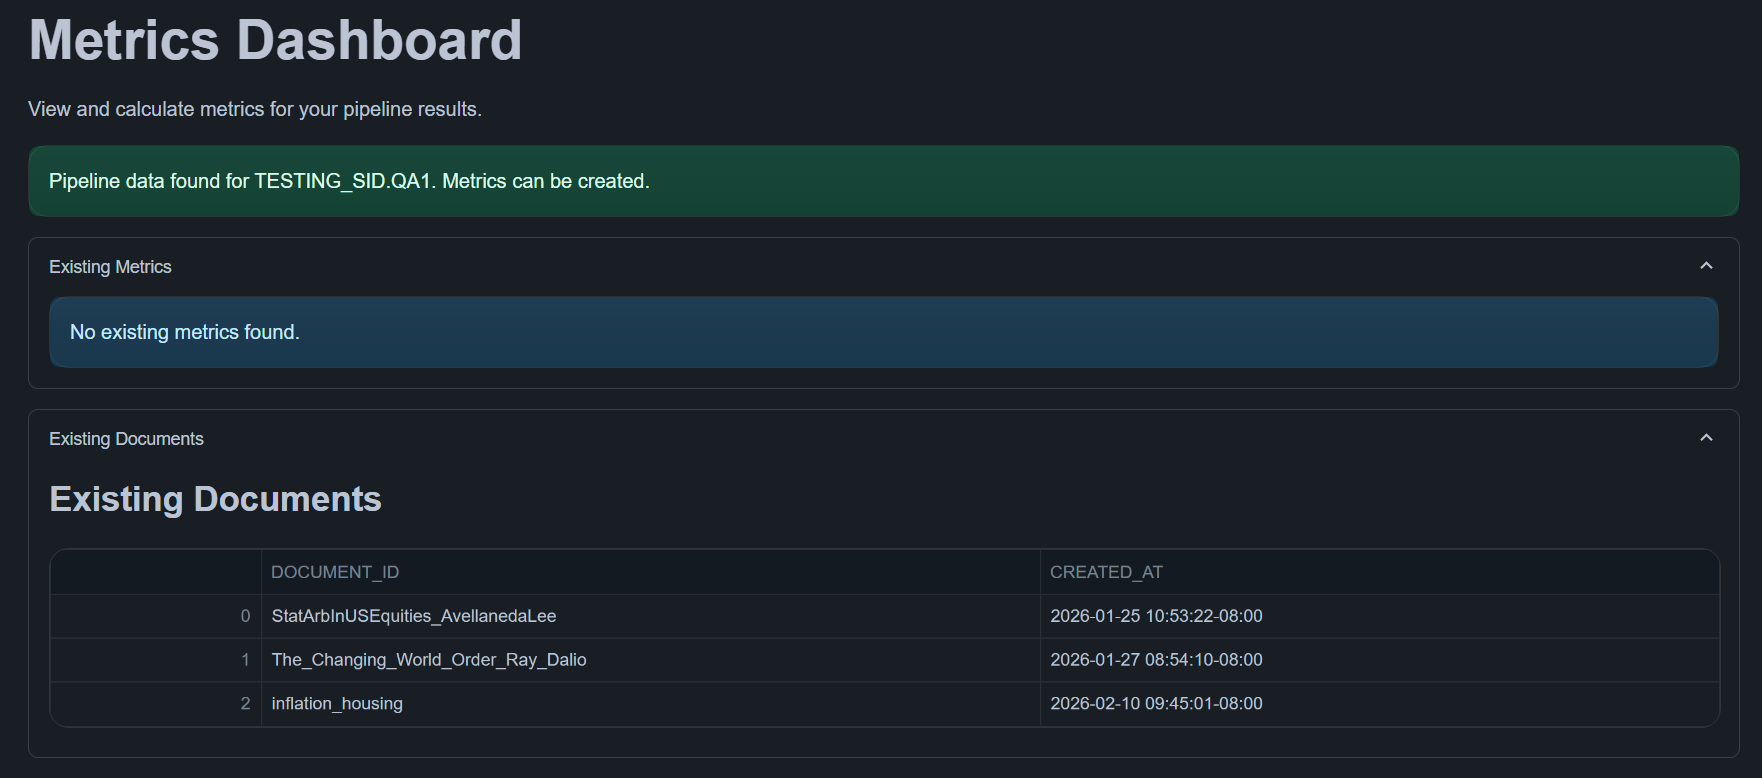
The dashboard provides a centralized view to monitor existing documents and previously calculated metrics.
Workflow
To generate a new metric, follow these three steps:
- Identify Topics: Review available relevancy and classification labels.
- Add Filters (Optional): Narrow the dataset to specific subsets.
- Build Formula: Define the mathematical relationship to save the metric.
Step 1: Available Topics
The system automatically detects data from your PIPELINE_LABELS table:

- Relevancy Topics: Topics providing binary
RELEVANTorIRRELEVANTlabels. - Classification Topics: Topics providing structured, custom labels (e.g.,
HAWKISH,DOVISH).
Step 2: Add Filter Conditions (Optional)
Filters restrict which sentences are included in the metric calculation.
Use filters when you want the metric to apply only to a specific subset of labeled data.
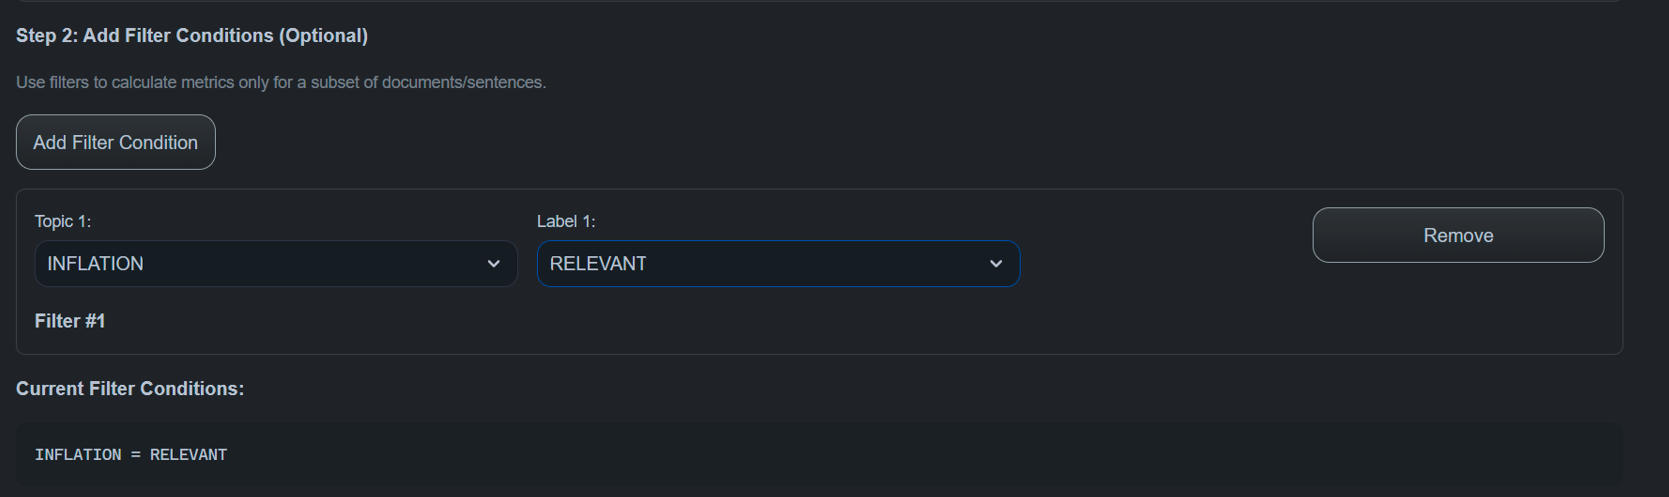
Each filter condition includes:
- Topic
- Label
When adding multiple filters, you can combine them using logical operators:
- AND → Both conditions must be satisfied
- OR → At least one condition must be satisfied
Examples
Single filter
INFLATION = RELEVANT
Multiple filters using AND
INFLATION = RELEVANT AND POLICY = HAWKISH
Multiple filters using OR
INFLATION = RELEVANT OR GROWTH = NEGATIVE
If no filters are added, the metric is calculated across all labeled sentences.
Step 3: Create Metrics Formula
Define how the metric value is calculated.
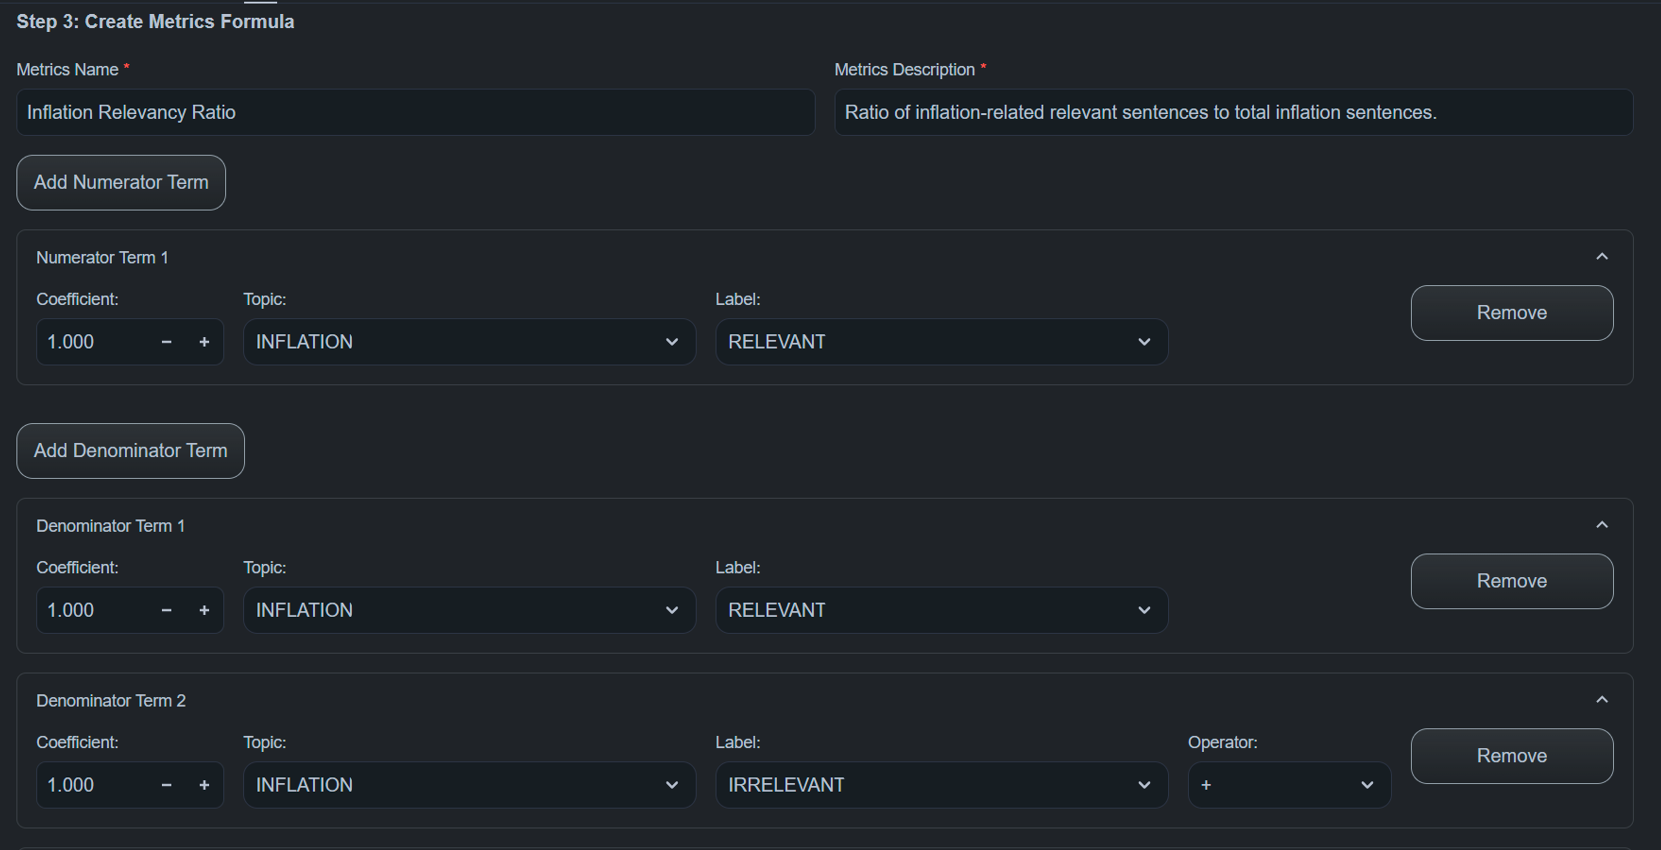
A metric consists of:
Numerator Terms
Each term includes:
- Coefficient
- Topic
- Label
Example:
1.0 × (INFLATION = RELEVANT)
Denominator Terms
Denominator terms define the total base used for normalization.
Example:
(INFLATION = RELEVANT) + (INFLATION = IRRELEVANT)
Example Metric
(RELEVANT) / (RELEVANT + IRRELEVANT)
This produces a relevancy ratio per DOCUMENT_ID.
Preview (Formula + SQL)
Review your logic before execution.
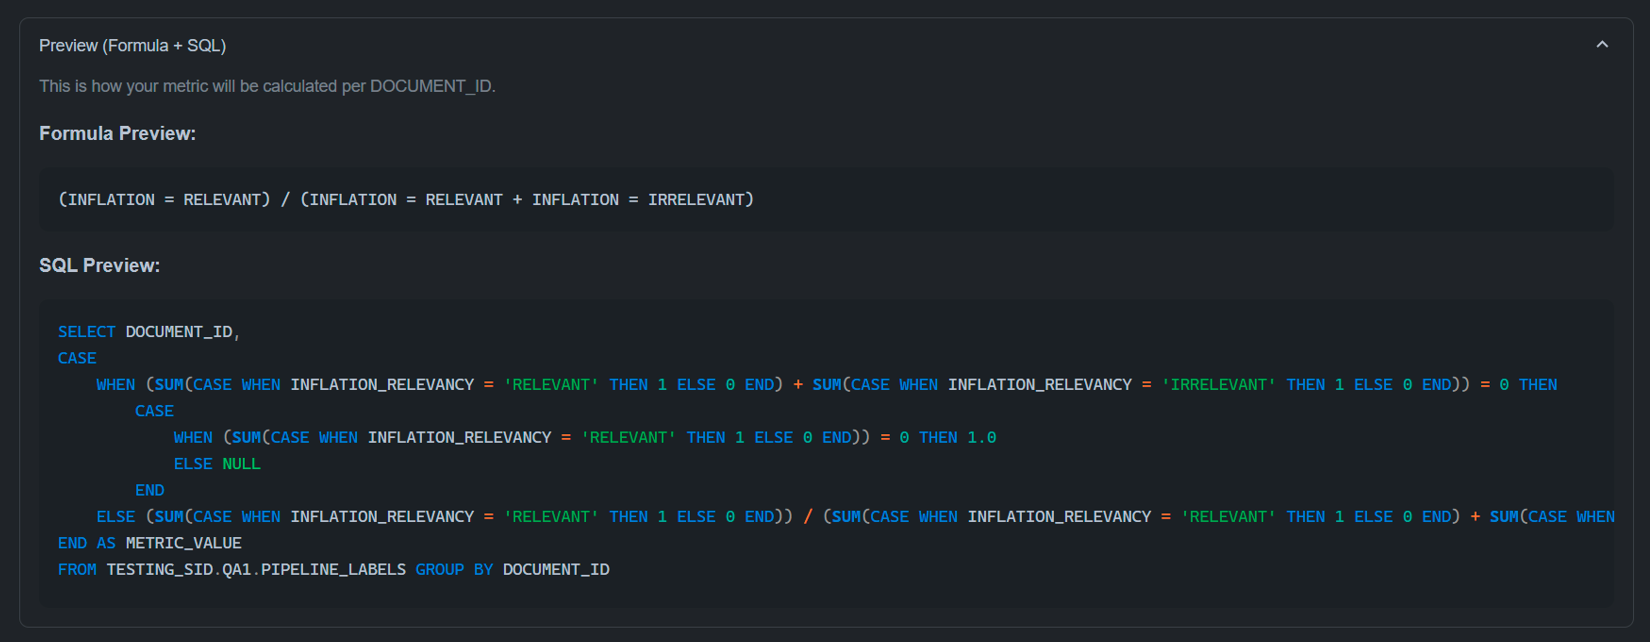
- Formula Preview: Displays the mathematical structure of your metric.
- SQL Preview: Shows the raw Snowflake SQL generated, highlighting the
GROUP BY DOCUMENT_IDlogic.
Results & Storage
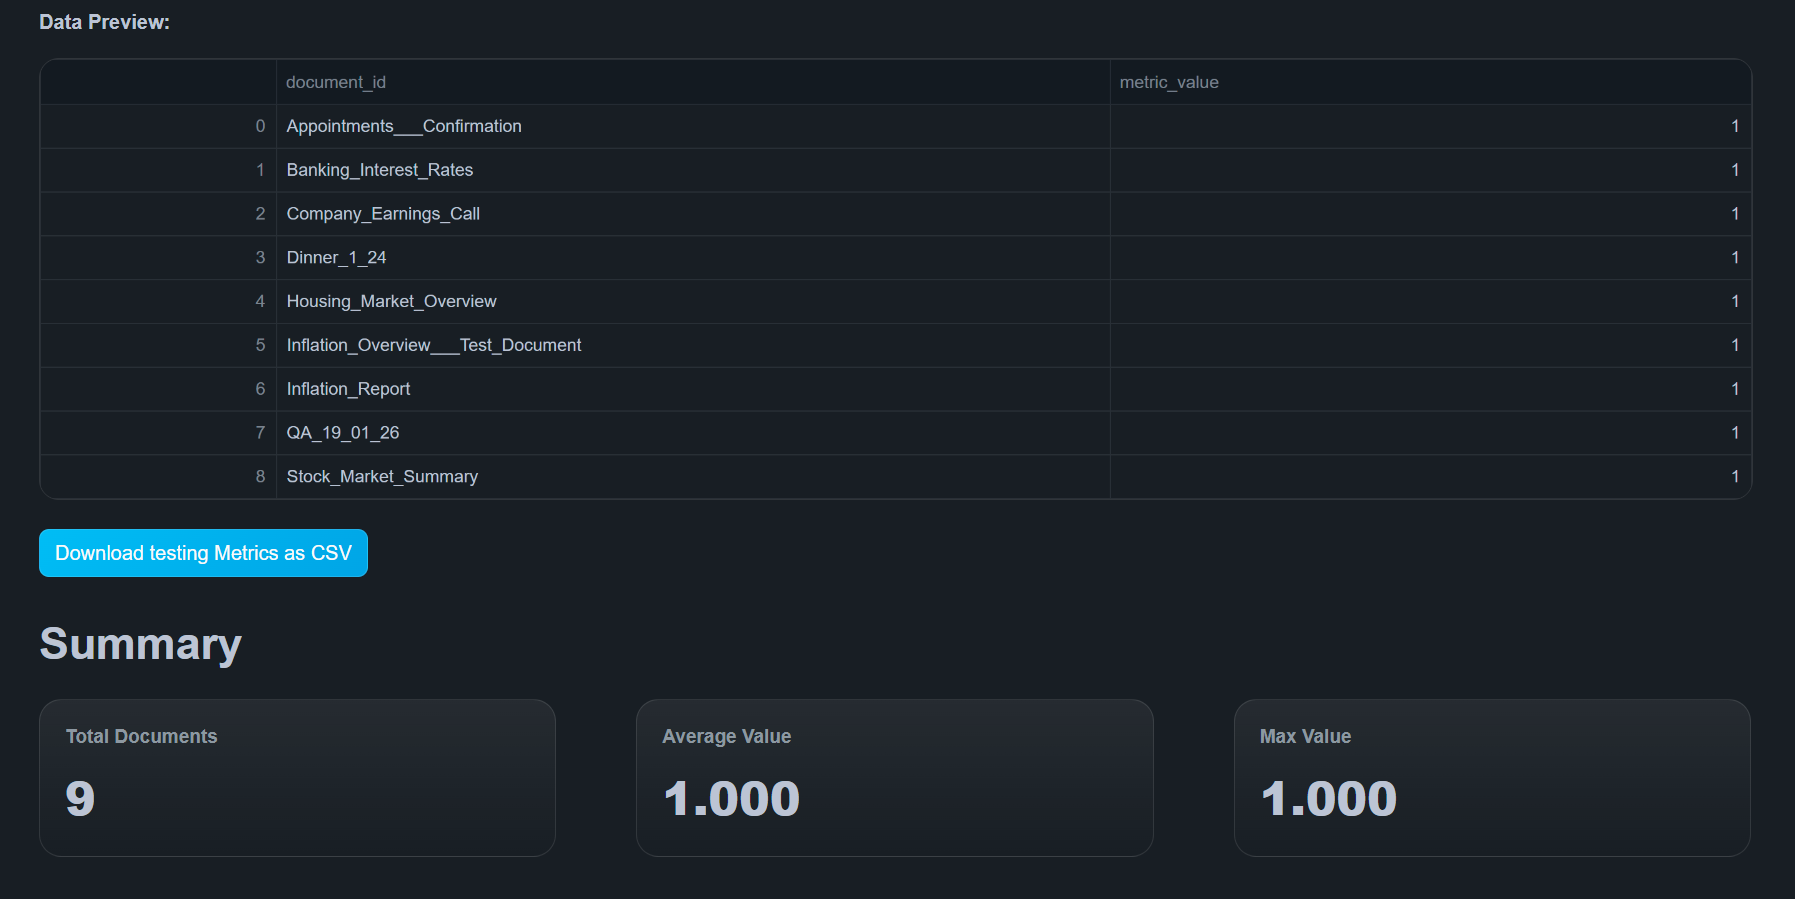
- Automatic Storage: Calculated metrics are saved directly into your configured Snowflake metrics table.
- CSV Download: Results are instantly available for download as a CSV file for external analysis.
- Overwriting: Creating a metric with an existing name will overwrite the previous calculations.
- Zero Denominators: If a document has no matching sentences for the denominator, the value defaults to
1.0to prevent calculation errors.
Troubleshooting
-
No topics visible → Ensure ZQ Classify completed successfully
-
Metric creation fails → Check formula structure
-
Permission errors → Verify Data Access Grants
-
Unexpected values → Review labels and filters
-
No output generated → Confirm pipeline data exists
-
Download not working → Refresh and recreate metric
Next Steps
- ZQ Classify - Run a new analysis to generate more topics for your metrics.
- Telemetry - Monitor metric calculation logs and execution status.
- Data Configuration - Update your target database or metrics table mapping.